Archive \ Volume.15 2024 Issue 2
Post-Intensive Care Syndrome Scale: Turkish Validity and Reliability Study
Abstract
This study aimed to analyze the Turkish validity and reliability of a scale to be used for the assessment of post-intensive care syndrome in patients surviving in the intensive care unit. This is a methodological study in which the Turkish version of the "Post-Intensive Care Syndrome Scale" developed by Jeong and Kang (2019) was performed. The population of the study consists of 350 people. The sample consisted of 225 patients due to voluntary participation, unavailability, and death. The researchers collected data by applying the Post-Intensive Care Syndrome Scale. The data in the scale were measured as a number, percentage, standard deviation, minimum, maximum, and mean. Exploratory Factor Analysis (EFA) and Confirmatory Factor Analysis (CFA) were applied for language and content validity and construct validity of the scale. There was a high level of agreement between the expert opinions regarding the items of the scale in terms of content validity of the "Post Intensive Care Syndrome Scale" (CSR=0.96). Exploratory factor analysis revealed that the scale has a three-factor structure, 17 items explained 69.64% of the total variance, and factor loadings ranged between 0.48-0.86. According to confirmatory factor analysis, Chi-square/sd=2.719 non-normed fit index=0.89 and comparative fit index=0.93. Cronbach's alpha reliability coefficient was 0.93. The study results showed the Turkish version of the Post-Intensive Care Syndrome. Scale meets the Turkish version criteria at an acceptable level and can be used in scientific research.
How to cite:
Download Citation
INTRODUCTION
Patients who survive in the intensive care unit face various disorders that can last for years after discharge and affect their daily lives [1]. With deteriorating health status, Post- Intensive Care Syndrome (PICS) usually occurs within 48 hours of admission to the intensive care unit (ICU) or after discharge [2, 3]. Patients with pulmonary disease, muscle disorders, psychiatric illness, and cognitive impairment before hospitalization are at higher risk of developing PICS [4]. The most important factors contributing to PICS include mechanical ventilation, immobilization, and sedation [1]. Patients hospitalized in the intensive care unit are mechanically ventilated for more than four days and sepsis is observed in 25-80% of patients. Weaknesses are also seen in 50-75% of patients [5, 6]. PICS is classified as physical, cognitive, and mental. Cognitive impairment is seen in 30-80% of patients discharged from intensive care. Cognitive impairment may vary in degree and may last for several years. Memory, language, attention, and visual skills are only a few of these cognitive deficits. 25–80% of patients have some form of physical impairment. The most common physical impairment is neuromuscular weakness, leading to decreased movement and repeated falls [7-9]. Other disorders include burnout, sleep disturbance, decreased appetite, and impaired pulmonary function. Depression, anxiety, and post-traumatic stress disorder constitute the mental disorders seen in patients. Depression is seen in 30% of post-ICU patients, anxiety in 70%, and post-traumatic stress disorder in 10-50% [10-14].
Considering all these results, evaluating the adverse effects of the syndrome caused by staying in intensive care and managing PICS becomes critical. The adverse effects experienced by intensive care patients were first defined as "Post-Intensive Care Syndrome" by the Society of Critical Care Medicine in 2010 [10, 15]. Jeong and Kang developed a PICS measurement scale [16]. The Post-Intensive Care Syndrome Scale, one of the measurement tools that can address the post-intensive care syndrome in three dimensions, is frequently used internationally to evaluate the effects of staying in intensive care in patients. In addition, the scale has few items and can be easily understood by patients [16].
The Turkish version of the PICS scale was conducted by İbrahimoğlu et al. [17]. We planned to carry out the Turkish validity and reliability study of the scale with a different sample group. This study can be of great benefit to the literature in our country and can be used in studies on "post-intensive care syndrome".
MATERIALS AND METHODS
Purpose and Type of Study
The objective of this study was to examine the validity and reliability of the ''Post Intensive Care Syndrome Scale''.
Population and Sample of the Study
The study population consisted of 350 patients. These patients were hospitalized in the intensive care units of "Van Yuzuncu Yıl University Dursun Odabaş Medical Center" for at least 48 hours in the last six months. They were over 18 years, could communicate, and were at least four weeks past discharge. Studies indicate that the required sample size in validity and reliability studies should be at least five to ten times the number of questions in the scale. Therefore, it was determined that at least 90 patients should be considered in the sample for the validity and reliability study of the 18-item PICS scale. A total sample size of 225 people was found to sufficiently represent the population [18]. Between January 15 and February 15, 2023, the data required for the study were collected.
Data Collection Tool and Method
The data of the study were obtained by the researchers by applying a questionnaire to patients who were treated and discharged from the intensive care units of a university hospital. The "Patient Information Form" and the "Post-Intensive Care Syndrome Scale," named initially "Post-Intensive Care Syndrome Scale," were used in the study.
Patient Information Form
"Patient Information Form" was designed by the authors based on the literature review and was composed of a total of 10 items, including age, gender, employment status, number of days in the hospital, diagnosis, type of intensive care unit, presence of chronic disease, previous surgery, number of days after discharge and readmission to hospital, and companion status.
Post-Intensive Care Syndrome Scale
"Post-Intensive Care Syndrome Scale" improved by Jeong and Kang (2019), is a Likert-type measurement tool. Scoring on the scale is 0=Never, 1=Sometimes, 2=Most of the time, and 3=Always. Scoring high on the scale corresponds to a high level of post-intensive care syndrome. "PICS Scale" includes 18 items and three sub-dimensions. The first sub-dimension, "Cognitive dimension," consists of 6 questions; the second sub-dimension, "The physical dimension, six questions; and the third sub-dimension, the mental dimension, consists of 6 questions. The lowest score in the scale evaluation is 0 and the highest score is 54. In the original study, Cronbach's alpha value was reported as 0.93 [16].
Ethical Dimension of the Study
Jeong and Kang (2019), who created the original form of the scale, were contacted by e-mail and written permission was obtained from the relevant author to use the original form of the scale to conduct the Turkish validity and reliability study of the "Post Intensive Care Syndrome Scale". Written permission was also obtained for the validity and reliability study of the scale. Written permission was also obtained from the ''Van Yuzuncu Yıl University Non-Interventional Clinical Research Ethics Committee'' (Decision No: 2023/01-01).
Following the ethics committee's permission, an institutional permission letter was obtained for the study from the organization where the survey was carried out for the implementation of the research. By calling the patients' contact numbers and explaining the objective of the research to them, patients who fit the research requirements were included. Detailed information about the research was also given. The researcher collected the data using the telephone interview technique, and it took approximately five minutes to complete the data collection forms for each patient.
Implementation of the Research
Language validity was performed for the validity of the Turkish version of the scale. Davis technique was used for content validity. Item analysis was used to examine the internal consistency and time invariance (test-retest) and reliability of the scale. Exploratory factor analysis and confirmatory factor analysis methods were used for the Turkish version. The test was administered to 30 participants twice at a 2-week interval.
Linguistic Equivalence
To ensure the linguistic equivalence of the scale, the Post Intensive Care Syndrome Scale was initially adapted from English to Turkish. The form was translated into English again. Finally, experts examined grammar, meaning, and vocabulary in the translated form and the original scale items. A common opinion was obtained that both forms were similar to each other, and the final version of the scale was created. After the translation process, the implementation phase was started to statistically determine the linguistic equivalence.
At this stage, a bilingual group design was adopted. The scale was administered to 30 pre-service teachers attending the 4th grade of the Department of English Language Teaching at a foundation university where the researchers work. We conducted a correlation analysis to determine the linguistic equivalence of the scale. The results of the analysis revealed that there was a significant positive correlation (r=91 and p < 01) between the Turkish form of the scale and the original form.
Content Validity
The Scale's content validity was determined according to the Lawshe method [19]. For content validity, the 18-item scale was sent to 4 faculty members from the Department of Internal Medicine Nursing, four faculty members from the Department of Surgical Nursing, two health professionals who are experts in their fields, and one measurement and evaluation expert and their opinions were obtained. A form was prepared for expert opinions. This form, which was sent to the experts via e-mail, was graded as (a) "Each question measures the construct to be measured", (b) "The item is related to the construction but unnecessary", (c) "The question does not measure the construct to be measured". With this method, content validity ratios were found by collecting the expert's opinions on each question. Scope validity ratios (CVRs) were determined as the ratio of the number of specialists who expressed the opinion of "Necessary" for an item to the total number of specialists who expressed their opinions about the question minus 1 [19]. According to the expert opinions, the questions that needed to be understood and needed to be corrected in the Turkish form were corrected.
Construct Validity
At this stage, confirmatory factor analysis (CFA) and exploratory factor analysis (EFA) techniques were employed. Construct validity steps, one of the construct validity steps were used with the help of a statistical software program to examine whether the scale was appropriate in construct validity [20].
Reliability Study
Cronbach's alpha reliability coefficient was used to determine the reliability of the scale. Item-total correlation analyses were used to examine the internal validity of the items that make up the scale. Test-retest mean scores were compared to determine the consistency of the scale. Pearson Correlation test was used to analyze the degree of significant difference between the measurements. After the sample size was determined, the scale was administered to 15 patients randomly selected from this sample for the second time at one-week intervals [20].
Statistical Analysis
SPSS 25.0 for Windows programı sonuçların istatistiksel analizi için kullanılmıştır (SPSS Inc.; Chicago, IL, ABD). Descriptive statistics including frequency, median, percentage, minimum-maximum values, mean and deviation were used to analyze demographic data. Values were analyzed to determine the content validity ratio (CVR) and content validity index (CVI) of the scale. CFA and EFA methods were utilized for the construct validity of the scale. Bartlett Sphericity test and Keiser-Mayer-Olkin tests were used to determine the scale content and the adequacy of the sample size. Confirmatory analysis was used to examine the factor structure and factor loadings of the scale. Paired groups t-test and Pearson Correlation test were used for the relationship between repeated measures.
RESULTS AND DISCUSSION
Findings Related to Individual Characteristics of Patients
The majority of the patients were male. The mean age was 60.56±15.80 years. It was determined that 75.6% of the patients had no previous work experience, and 88.4% were not working. The duration of hospitalization ranged between 2 and 24 days, the mean number of days of hospitalization was 4.6±2.9, and 65.8% of the patients were accompanied. 53.3% of the patients had heart-lung, 21.3% cerebrovascular, 9.8% cancer, 8.4% liver-gastrointestinal system, 4.9% spinal injury, and 2.2% kidney diseases. 35.6% of patients had previous surgery. 47.6% of the patients stayed in the cardiology intensive care unit. When patient admissions were evaluated, it was concluded that 61.3% did not reapply to the hospital. When the admission rates of the patients were evaluated, it was seen that 46.2% were outside of emergency conditions. It was understood that 85.3% of the patients were not resuscitated, and 81.8% were not connected to a ventilator. The mean time after discharge was 106.21±38.44.
The mean for "Cognitive Syndrome" was low, 320±0.50 (Min=,00; Max=3); the mean for "Physical Syndrome" was medium, 1,04±0.78 (Min=,00; Max=3), the mean for "Mental Syndrome" was low,627±0.63 (Min=,00; Max=3), the mean of "Post-Intensive Care Syndrome Scale total" was low 668±0,55 (Min=,00; Max=3) (Table 1).
|
Table 1. PICS Scale Score Means |
|||||
|
Subdimensions |
N |
Means±Ss |
Min. |
Max. |
Scale Ratio |
|
Cognitive Syndrome |
225 |
,320±0,50 |
,00 |
3,00 |
0-3 |
|
Physical Syndrome |
225 |
1,04±0,78 |
,00 |
3,00 |
0-3 |
|
Mental Syndrome |
225 |
,627±0,63 |
,00 |
3,00 |
0-3 |
|
Post-Intensive Care Syndrome General |
225 |
,668±0, ,55 |
,00 |
3,00 |
0-3 |
Content validity of the PICS Scale
After ten expert opinions evaluating the scale items according to the Lawshe Technique, the content validity rates and the scale content validity index were calculated as 0.96 [19].
Findings Related to the Analysis of the Items in the Scale
Before analyzing the structural validity of the Post-Intensive Care Syndrome Scale, question-total score analysis was performed, and the total correlation values of the 18 items in the scale were examined. The question-total score correlation results for 17 items (1,2,3,4,5,6,7,8,8,9,9,10,10,11,12,14,15,16,17) were between r=0.57-0.73 and for 1 item (13) r=0.28. Research shows that this parameter is required to be r=0.30 and over [21]. As explained, 1 item with a correlation value lower than r=0.30 was removed from the scale. The total number of items was determined as 17. Ibrahimoglu et al. in their study, removed 8 items (1, 2, 8, 10, 12, 13, 15, 17) from the scale. They also found the reliability of the scale to be alpha=0,94 [17]. We found the reliability of the scale as alpha=0.93.
Results Related to the Analysis of Construct Validity
Exploratory Factor Analysis (EFA)
Kaiser-Meyer Olkin test coefficient was used to examine the adequacy of the sample size of the PICS Scale. The Kaiser-Meyer Olkin (KMO) coefficient was found to be 0.90.A KMO value above 0.50 is sufficient. Barlett's test result was X2=2862.445; p=0.000 (p<0.001) [22]. Principal Component Analysis and Varimax Rotation were used for factor analysis. First, factor analysis was performed with 18 items without using varimax rotation, and it was determined that the items were distributed into three sub-dimensions. After this process, items with factor loadings below 0.30 [18, 23, 24] were removed from the scale using the varimax rotation technique. In the literature, while loadings above 0.3 can be considered significant if the sample size is 350, it is stated that it should be 0.4 when this number is 200, 0.5 when it is 120, and 0.6 when it is 85 [25]. In the final version of the remaining 17-item scale, it was found that it was collected in three sub-dimensions.
These three factors determined by factor analysis explain 69.641% of the overall variation of the scale. The variance values explained by the factors are F1=25,929%, F2=24,684%, and F3=19,028% respectively.
The minimum value in the question load value is 0.50 and the maximum load value is 0.86. These results were found to be within the normal range in the factor in which 17 items were distributed and gathered in three factors with eigenvalues greater than 1 [25] (Table 2).
|
Table 2. Factorized Item Loadings and Item Total Correlation Values |
||||
|
|
Factors |
Question-Total Correlation |
||
|
1 |
2 |
3 |
||
|
Item 4 |
,831 |
,302 ,860 ,853 ,760 ,758 ,723 ,654 |
|
,646 |
|
Item 5 |
,822 |
|
,649 |
|
|
Item 3 |
,822 |
|
,631 |
|
|
Item1 |
,753 |
|
,594 |
|
|
Item 2 |
,710 |
|
,683 |
|
|
Item 6 |
,685 |
,316 |
,687 |
|
|
Item 18 |
,505 |
,480 |
,672 |
|
|
Item10 |
|
|
,737 |
|
|
Item 9 |
|
|
,669 |
|
|
Item 7 |
|
|
,681 |
|
|
Item 8 |
|
|
,693 |
|
|
Item11 |
|
|
,681 |
|
|
Item 12 |
|
,376 |
,737 |
|
|
Item 15 |
|
,825 |
,664 |
|
|
Item 17 |
|
,823 |
,675 |
|
|
Item 16 |
|
,819 |
,613 |
|
|
Item 14 |
,352 |
,540 |
,578 |
|
Confirmatory Factor Analysis (CFA)
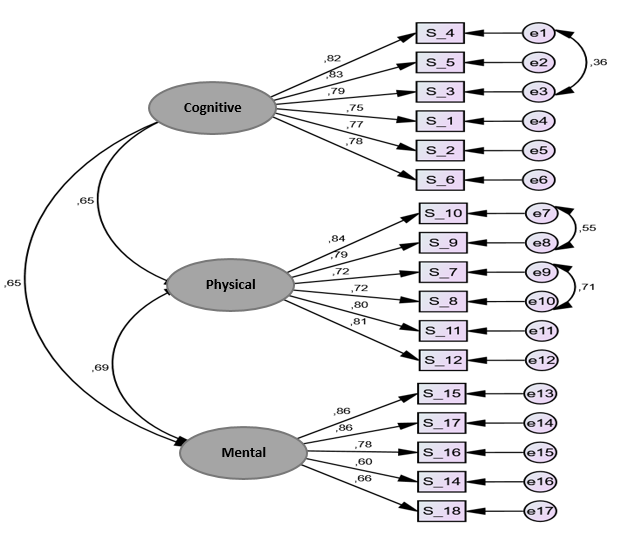
Exploratory factor analysis revealed that the scale had a three-factor structure of 17 questions. CFA was conducted on the obtained data. The standard values of the 17- question and three-factor MISS Scale obtained after CFA are presented in Table 2. In our study, χ2=307,247; sd=113; RMSEA=0.88; GFI=0.86; AGFI=0.81; CFI=0.93; IFI=0.93, which are the fit indices frequently used by Şimşek (2007) [26] (Table 3). The way diagram obtained after exploratory factor analysis is given in Figure 1. The path diagram shows that the factor loading values of the items in the scale vary between 0.60-0.86.
|
Table 3. Fit Results of the PICS Scale |
|
|
Compliance index |
Value |
|
Chi-square (X2) |
307.247 |
|
P- value |
0.000 |
|
Degree of freedom |
113 |
|
Chi-square (X2)/Sd |
2.719 |
|
RMSEA |
0.088 |
|
SRMR |
0.039 |
|
NNFI |
0.896 |
|
RFI |
0.875 |
|
CFI |
0.931 |
|
IFI |
0.931 |
|
GFI |
0.865 |
|
AGFI |
0.817 |
RMSEA=Mean Square Root of Approximate Errors,
SRMR=Square Root of Standardized Mean Errors,
NNFI=Non-normed Fit Index, CFI=Comparative Goodness-of-Fit Index, IFI=Excess Fit Index, GFI=Goodness-of-Fit Index, AGFI=Adjusted Goodness-of-Fit Index
|
|
|
Figure 1. Path Diagram of the PICS Scale |
Internal Consistency Analysis for Reliability
Cronbach Alpha values were analyzed. The total reliability value of the scale was determined as alpha=0.93. The reliability values of the subscales were alpha=0.90 for F1=6 items, alpha=0.91 for F2=6 items, and alpha=0.86 for F3=5 items. A statistically highly significant positive correlation (p<0.001 and p<0.005) was found between the overall score and all subscale scores.
The agreement among the subscales of the scale was evaluated by the Spearman-Brown correlation analysis technique and statistically highly positive and statistically significant correlations (p<0.01 and p<0.05) were obtained among the total score and all subscale scores (Table 4).
|
Table 4. Correlation Analysis of Scale Dimensions. |
|||||
|
Correlations |
|||||
|
|
Cognitive |
Physical |
Mental |
PICS Scale Total |
|
|
Cognitive |
r |
1 |
,578** |
,636** |
,825** |
|
p |
|
,000 |
,000 |
,000 |
|
|
Physical |
r |
,578** |
1 |
,624** |
,895** |
|
p |
,000 |
|
,000 |
,000 |
|
|
Mental |
r |
,636** |
,624** |
1 |
,854** |
|
p |
,000 |
,000 |
|
,000 |
|
|
PICS Scale |
r |
,825** |
,895** |
,854** |
1 |
|
p |
,000 |
,000 |
,000 |
|
|
*p<0,05, **p<0,01
Reliability of the PICS Scale Over Time
As a result of the paired groups t-test among the test-retest scores of the scale, there was no important relationship between the two measurements obtained from the total scale (p>0.05) and there was a very high positive meaningful correlation among them the two measurements(p<0.05).
Patients in intensive care experience mental, cognitive, and physical impairments after discharge. This situation affects not only the patient himself/herself but also his/her family and relatives. Nursing care is important in preventing PICS [2, 27]. After the Turkish version study of the PICS Scale, which consists of three sub-dimensions and 18 items that can evaluate the effects of staying in intensive care as a syndrome in post-intensive care patients, our findings showed that the scale met the criteria in terms of linguistics, contextual, structural and reliability validity and could be easily used on patients. The original form of the scale was retained after the analysis but only the 13th item was excluded due to low factor loadings, and the final version was finalized with 17 items.
It is recommended that the content validity index should be at least 0.80. In the content validity examination conducted in our study, it was determined that the agreement between expert opinions, in other meaning, the content validity value is very strong (0.96) and the scale fulfills the content validity criteria [20, 28]. In the literature, a KMO value above 0.60 and approaching 1 indicates that the data are suitable for factor analysis. Gürsakal says (2022), if a KMO analysis results above 0.50 indicates that factor analysis can be performed. A significant Bartlett's test of sphericity indicates that the correlation matrix of the items in the scale is suitable for factor analysis [29]. In our research, the KMO coefficient and Barlett Sphericity test were applied to measure the adequacy of the scale in terms of construct validity. It was determined that the KMO value was 0.90 and Barlett's test was significant.
The PICS Scale demonstrated a three-factor structure as per the original, and these three components explained 69.64% of the total variance, according to the findings of the EFA carried out in our study. This finding shows that the questions of the PICS Scale have sufficient validity and that each of the questions is highly related to the scale.
In the last step of the validity analyses in our study, the factor loadings and scale compatibility values of the scale were examined in CFA. According to the findings, the three factors in the scale explained the majority of the total variance (69.64%), and therefore, the factor structure of the scale is strong. Regarding compatibility indices, GFI and AGFI coefficients above 0.90 in the literature indicate a good fit. RMSEA value less than 0.10 and χ2/sd less than 2.0 indicate a good fit. Considering the compatibility indices in our findings (χ2/sd=2.719 and RMSEA=0.088), it can be said that the Turkish version of the scale is compatible with the original model [20].
In our study, Cronbach's alpha coefficient was found to be 0.93. In the literature, it is reported that Cronbach's alpha coefficient varies between 0.0-1.0 and that the scale is very reliable if the coefficient is 0.80 and above [20]. Our findings showed that the correlation among the test-retest scores of the PICS Scale was very strong (0.89) and the scale was a consistent measurement tool over time.
CONCLUSION
In this study, the validity and reliability of the PICS Scale were examined in patients hospitalized and treated in the intensive care unit. Our findings showed that the sensitivity and specificity of the PICS Scale were high. Applying the PICS Scale, which can evaluate the post-intensive care syndrome from a three-dimensional and subjective perspective in clinical research, will be useful. However, considering that the post-intensive care syndrome has a different meaning for each patient, it may be recommended to determine the factors that cause this syndrome and to implement preventive interventions.
ACKNOWLEDGMENTS: We thank the researchers who conducted this study.
CONFLICT OF INTEREST: None
FINANCIAL SUPPORT: None
ETHICS STATEMENT: Van Yuzuncu Yıl University Non-Interventional Clinical Research Ethics Committee (Decision No: 2023/01-01).
References
- Lee M, Kang J, Jeong YJ. Risk factors for post-intensive care syndrome: A systematic review and meta-analysis. Aust Crit Care. 2020;33(3):287-94.
- Brown SM, Bose S, Banner-Goodspeed V, Beesley SJ, Dinglas VD, Hopkins RO, et al. Approaches to addressing post–intensive care syndrome among intensive care unit survivors. A narrative review. Ann Am Thorac Soc. 2019;16(8):947-56.
- Kerckhoffs MC, Kosasi FFL, Soliman IW, van Delden JJM, Cremer OL, de Lange DW, et al. Determinants of self-reported unacceptable outcome of intensive care treatment 1 year after discharge. Intensive Care Med. 2019;45(6):806-14.
- Kosinski S, Mohammad RA, Pitcher M, Haezebrouck E, Coe AB, Costa DK, et al. What is post–intensive care syndrome (PICS)? Am J Respir Crit Care Med. 2020;201(8):P15-6.
- Davidson JE, Harvey MA. Patient and family post–intensive care syndrome. AACN Adv Crit Care. 2016;27(2):184-6.
- Bryant SE, McNabb K. Postintensive care syndrome. Crit Care Nurs Clin North Am. 2019;31(4):507-16.
- Colbenson GA, Johnson A, Wilson ME. Post-intensive care syndrome: Impact, prevention and management. Breathe (Sheff). 2019;15(2):98-101.
- Yuan C, Timmins F, Thompson DR. Post-intensive care syndrome: A concept analysis. Int J Nurs Stud. 2021;114:103814.
- Stam HJ, Stucki G, Bickenbach J. Covid-19 and post-intensive care syndrome: A call for action. J Rehabil Med. 2020;52(4):1-4.
- Fernandes A, Jaeger M, Chudow M. Post–intensive care syndrome: A review of preventive strategies and follow-up care. Am J Health Syst Pharm. 2019;76(2):119-22.
- Inoue S, Hatakeyama J, Kondo Y, Hifumi T, Sakuramoto H, Kawasaki T, et al. Post‐intensive care syndrome: Its pathophysiology, prevention, and future directions. Acute Med Surg. 2019;6(3):233-46.
- Zante B, Camenisch SA, Schefold JC. Interventions in post-intensive care syndrome-family: A systematic literature review. Crit Care Med. 2020;48(9):e835-40.
- Held N, Moss M. Optimizing post-intensive care unit rehabilitation. Turk Thorac J. 2019;20(2):147-52.
- Rousseau AF, Prescott HC, Brett SJ, Weiss B, Azoulay E, Creteur J, et al. Long-term outcomes after critical illness: Recent insights. Crit Care. 2021;25:1-7.
- Smith S, Rahman O. Post intensive care syndrome [Internet]. Accessed: 30.03.2023. Available from: https://www.ncbi.nlm.nih.gov/books/NBK55 8964/
- Jeong YJ, Kang J. Development and validation of a questionnaire to measure post-intensive care syndrome. Intensive Crit Care Nurs. 2019;55:102756.
- İbrahimoğlu Ö, Mersin S, Akyol E. Turkish adaptation of the post-intensive care syndrome questionnaire: A validity and reliability study. Ann Clin Anal Med. 2022;13(4):446-50.
- Şencan H. Validity and reliability in social and behavioral measurements. 1th ed. Ankara: Seçkin Publishing; 2005. p. 22-120.
- Lawshe CH. A quantitative approach to content validity. Pers Psychol. 1975;28(4):563-75.
- Karasar N. The qualities required in measurement and tools. The scientific research method. 19. Pressing. Ankara: Nobel Publication Distribution; 2023. p. 53-147.
- Karadağlı F, Ecevit Alpar Ş. A scale development study: The self-care behavior scale according to the theory of self-care insufficiency in patients undergoing chemotherapy. Mersin Univ J Health Sci. 2017;10(3):168-81.
- Çınar F. The role of stakeholder participation in the relationship between the accountability principle and corporate performance; An application in hospital enterprises. Vision E-J. 2015;6(13):12-30.
- Öztürk H, Babacan E. A scale development study: The occupational safety scale for medical personnel working in a hospital. J Educ Res Nurs. 2012;9(1):36-42.
- Viswanath K, Blake KD, Meissner HI, Saiontz NG, Mull C, Freeman CS, et al. Occupational practices and the making of health news: A national survey of US health and medical science journalists. J Health Commun. 2008;13(8):759-77.
- Orçan F. Exploratory and confirmatory factor analysis: Which should be used first. J Meas Eval Educ Psychol. 2018;9(4):413-21.
- Şimşek ÖF. Introduction to structural equation modeling, basic principles, and LISREL Applications. Ankara: Ekinoks Publications; 2007. p. 9-44.
- Yeni T, Enç N. Post-intensive care syndrome and nursing management. J Intensive Care Nurs. 2022;26(1):18-26.
- Kahraman BÖ, Kahraman T, Özsoy İ, Tanriverdi A, Papurcu A, Sezgin NH, et al. Validity and reliability of the Turkish version of the multidimensional dyspnea profile inoutpatients with respiratory disease. Turk J Med Sci. 2020;50(8):1930-40.
- Gürsakal S. Multivariate statistical analysis techniques for social sciences. Ankara: Nobel Academic Dissemination; 2022. p. 1-13.
